
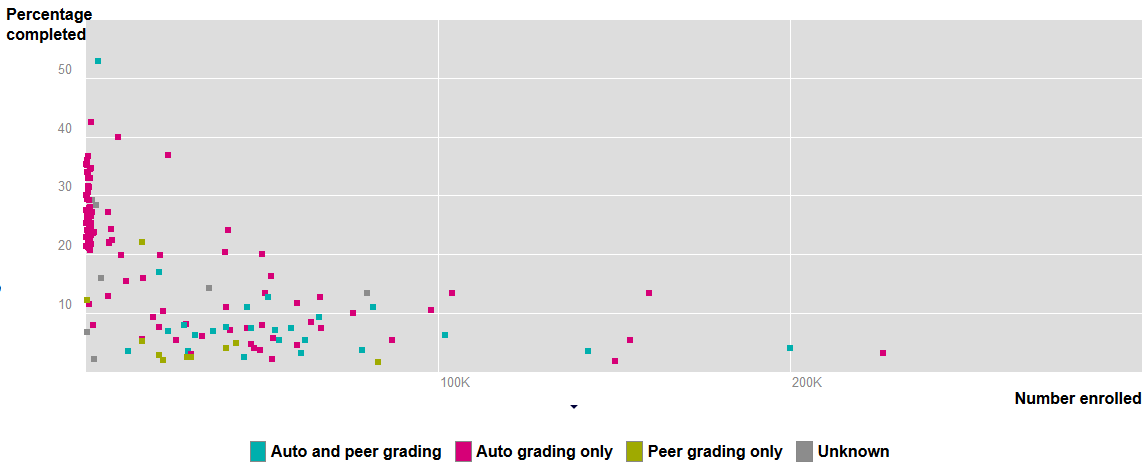
Via a combination of thinking about ‘what makes a successful MOOC?’, and looking for a topic for my final project on the Infographics MOOC, I decided to try to pull together the various statistics floating around online about MOOC completion rates. I’m trying to see if any differences emerge on the basis of platform or the assessment methods used.
My draft graph synthesising everything I’ve found so far can be found here: http://www.katyjordan.com/MOOCproject.html Clicking on any of the data points will pull up a bubble with more information about that course, and a link back to the data source.
(note: the interactive version of the chart uses javascript. It has problems with some versions of Internet Explorer; I’ve found it works more consistently with Firefox. If you are having problems, click the pictures below to view screen grabs, although these may not be as up-to-date as the interactive chart).

This is off to quite an interesting start, but I need help sourcing more data and categorising courses according to their assessments.
Courses which I have completion rates for, but need more information about how they were assessed, include:
3.091x Introduction to solid state chemistry at EdX, which ended approximately 2013-016.00x Introduction to Computer Science and Programming at EdX, which ended approximately 2013-01- Artificial Intelligence (Sebastian Thrun), ran in Autumn 2011
Circuits and Electronics, at MITx in 2012 (first time the course ran)Circuits and Electronics, at MITx/EdXComputational Investing, Part 1 at Coursera, ended approx 2013-01Software as a Service, Coursera, ended approx 2012-06Gamification, Coursera, ended approx 2012-10Introduction to genetics and evolution, Coursera, ended approx 2012-12Introduction to Machine Learning (Andrew Ng), 2011
– Used a combination of MCQs and autograding problems sets
– Used a combination of MCQs and autograding problems sets
– Used a combination of MCQs and autograding problems sets
– Used a combination of MCQs and autograding problems sets
– Used a combination of MCQs and autograding problems sets
– Used a combination of MCQs and peer graded essays
– MCQs
If you studied on any of these courses, please do post a comment here outlining how it was assessed (just MCQs? Peer graded projects? Or something else?). If you know about any other sources of data about MOOC completion rates (how many registered and how many completed) in addition to the ones already in my chart, please do post a comment too (& a link to the data source), and I’ll add them to the chart. Thanks & looking forward to seeing the picture which emerges!

Thank you for all the hard work you have put into collating this data – I will be interested to see more analysis as it becomes available.
Hi,
A SciWrite course I took last Autumn at Stanforc (Coursera), guided by Kristin Sainani, had the following exit stats:
Nearly 3400 students passed the course. This was about 10% of those who registered and 26% of those who attempted any assignments or quizzes in the course. Also, more than 800 students earned a distinction (>90% points scored; auto+peer combination)! This was nearly a quarter of the class. We also had 2 students earn a perfect 100%!
(https://class.stanford.edu/courses/Medicine/SciWrite/Fall2013/info)
Hope this helps,
– mnow
Hi Kathy,
here are the completion rate for MOOc GdP, the first xMOOC in France http://goo.gl/N2RVi
in short
3490 enrolled
2310 answered at least one question
34% “no-show”
58% basic certif. success rate => 1330
78% advanced certf.f success rate => 440
Hi Rémi, many thanks for sharing this data! I have added it to the chart. I would be interested in finding out more about how the course was assessed. Thanks again 🙂
These are super impressive numbers and I would like to know what they did to reach these.
I tried to calculate them, but wasn’t able to.
Of 3490 enrolled only 2310 answer at least one question we get 34%
Basic certification, not sure what that means, but apparently 1330 of students reached that level: 1330/3490 = 38%
440 students got the advanced certificate 440/3490 = 13%
Or am I doing something wrong?
Still good numbers, and it would be great to get know what the different levels mean,, but 13% is more in line with the general results, Mark.
(to (@finnern) : sorry for the late reply => detailled figures for GdP#1 here http://goo.gl/jwUwzv.
the catch is my success rate is calculated relative to *active students* (but all numbers are provided if you want a gross success rate)
Pingback: MOOCs y creatividad | RED
Pingback: Historiann stumbles out of the wilderness to find the Lords of MOOC creation have successfully placed an advertorial in the Washington Post : Historiann : History and sexual politics, 1492 to the present
Pingback: An online college revolution is coming – The Washington Post | MY VIETNAM
Pingback: Massive Open Online Courses (MOOC): Where can I find data and statistics on MOOCs? - Quora
Pingback: Are there any Algorithms and Data Structures courses MOOCs using python | Service Catalog Toolkit
Pingback: Which French Universities have launched or announced a MOOC | Service Catalog Toolkit
I took your completion rates data (n=51) along with other data and put into an Excel spreadsheet (entering some 400 bits of data) readying it for a regression. I ran two regressions: completion rate against course enrollment and then against course duration. The course enrollment x coefficient was negative/zero (close to significance) while the course length also was negative and not anywhere near significance. If anyone wants the data set (there are 51 rows of data and some 8 columns for data analysis), please email piczakm@mcmaster.ca. Thank you for gathering the raw data.
Pingback: Synthesising MOOC completion rates | OER & ...
Katy – some courses are available “for free” or “for credit” (e.g., Dino 101: Dinosaur Paleobiology (http://uofa.ualberta.ca/dino101). Do you have this data?
Hi Craig, I’ve not got any data about the differences between completion ‘for credit’ and have just been using the broad definition of ‘free’ certificates so far. I’m aware of a couple of examples of Coursera course for which information about the proportion of ‘signature track’ (paid for, ID verified) students – these include the 2013 Gamification course ( http://www.youtube.com/watch?v=E8_3dNEMukQ&feature=youtu.be ), and there is information about number of ‘signature track’ enrollments for some of the Duke courses on their blog ( http://cit.duke.edu/blog/2013/07/healthcare-innovation-and-entrepreneurship-final-comments/ ).
Hi,
here are a few numbers from openhpi.de, the MOOC of HPI:
https://blog.openhpi.de/2013/08/statistiken-zur-abschlussrate/
More information can be found here: https://blog.openhpi.de/de/
Also if you wanne now more, please dont hesitate to contact me!
Jan, openHPI Team
Hi Jan! Many thanks for sharing this data, and I have added the openHPI courses to the chart. I would also be interested in finding out more details about how the courses were assessed. Cheers! Katy
Katy, I actually think that you should re-do this work with stricter rules about what “retention means”. In the pure-hype phase of this space people reported the “160,000 registered” number publicly – and your work here I think was very influential in poking a hole in that hype.
But frankly at this point unless we standardize on the “denominator” for this data – it is pretty much useless to do comparisons or draw any conclusions.
I would suggest that you leave this work as it is and start a new data collection where the measure is course-completion / first-week completion or course-participation-in-last week / course-participation-in-first-week.
My most recent Coursera class had 41% completion rate by both of those measures. If we want to really track these trends we need to move from press-release data to real data.
and I still find that the intent of many participants is not to complete the course, but to access certain portions of it. these are what we might have once considered students auditing a class. they get exactly what they want from the class and then exit. they may even look like “lurkers” but they have objectives that don’t fit our traditional course objectives http://www.serendipity35.net/index.php?/archives/2826-Rethinking-Lurkers-in-the-MOOC-Experience.html
Hi Dr. Chuck, Thanks for your post – I agree that there are other measures of course completion that are useful in addition to those based on enrollment. I’ve started working on digging deeper into this recently and hope to continue working on it during the autumn. I’ll keep you posted… 🙂
Pingback: 100+ONLINE COLLEGE RESOURCES on OPEN COURSEWARE and MOOCs | Education Progresses Best When Knowledge is Shared Openly and Freely
Hi Katy,
OpenSAP has just recently finished their first MOOC:
Introduction to Software Development on SAP HANA
https://open.sap.com/blog/hana1-key-metrics/
Here are the key metrics:
The 7 weeks course was held from May 27 through July 15, 2013.
18,033 learners were enrolled on day 1 of the course.
When the final exam ended, this number had increased to 40,386.
15,748 learners actively participated in the course.
10,795 learners took the final exam.
We issued 9,383 graded records of achievement.
500,000 video lectures were watched.
500,000 self-tests were conducted.
70,000 assignments were submitted.
5,500 posts were created in the discussion forum.
9,879 cloud-based SAP HANA instances were deployed by the course participants.
160 private discussion groups were created by participants on openSAP.
3 local meet-up sessions were organized by course participants in Walldorf, Bangalore, and Sofia.
16 % of the course participants came from SAP.
The female to male ratio of course participants was 1:5.
This course is interesting, as attendance mushroomed from 18,033
to 40,386 while the course was going on.
So what is the retention rate?
I think all 10,795 that took the final examine whether they got their record of achievement or not should be counted as they did the whole course.
If you compare that to the number of students sign up at day one, it will make a nice 60% retention rate, but the sign up number at the end of the course when the final test was taken is the better one: 40,386
Which gives us a beautiful retention rate of 27%
Why is it so high? In memory database HANA is a brand new technology that has an enormous potential to give you a boost in your career or differentiate you from other students once getting out of college.
With Thomas Jung and team the best person was chosen to present the course. Weekly assignments kept people on track.
These are just my guesses, it needs to be deeper analysed. .
With thanks to @annindk : Coursera’s #mapmooc: According to a message on the MOOC from Anthony Robinson, our peerless instructor, the overall completion rate was 8.8% for those who logged into the course at least once (‘active’ users). Out of 47,000+ registrants 34,000+ were active in the class at some point, with around 9000 active during the last week. 3064 passed, 1211 w Distinction, 1853 Normal.
I don’t know if you’re still looking for data on MOOC completion rates, Katy, but if so, here’s some rough data on one I just finished, which came from an email the course organizer sent out:
Course: Social Psychology, Scott Plous, Wesleyan U, on Coursera
Enrollees: Reported to be over 200,000. (I don’t have exact figures on this)
Completion:
“I’m pleased to report that nearly 8,000 members of our class completed the exam, and of the students who took the exam and completed at least two other course assignments, around 80% earned enough points to receive a Statement of Accomplishment (70 course points). I’m also pleased to report that over 18% of students who took the exam and completed at least two other assignments earned a Statement with Distinction (90 course points).”
I’m always on the lookout for more data 😉 Many thanks for posting this information!
Hi,
I think there is one error in the graph about “completion rate f(course length)”. I’m currently doing the second edition MOOCGdP (the one with 50.7% of completion rate at the first edition). When I’m looking to the course length graph the only point I see at 50% is a course of 14 weeks but MOOCGdP is 5 weeks long not 14 weeks.
It seems natural for me a longer course should have a lower completion rate. I might be wrong (I don’t have your data) so I let you check that one. This correction can help for a better data interpretation. By the way the second edition of this course is at 10,000 students.
Hi – thanks for spotting this! I’ve corrected the data in the chart now.
Hi!!!
This is the data from my Ser más creativos MOOC on Coursera by UNAM (Mexico’s National University):
enrolled: 51,833
active students: 35,816
earned certificate: 6,180
(normal: 2,128 and with distinction: 4,052)
12,239 threads (49,979 posts, 11,635 comments, 24,458 votes, and 14,172 reputation points).
streaming views of videos: 438,395 with 133,584 downloads.
The course included: 2 quizzes, one self evaluated design challenge and two peer evaluated and self evaluated design challenges. 19,862 products or services were developed.
It was a 6 week course, with 4-6 hour/week dedication time. Everything was in Spanish.
Thanks and greetings from Mexico!!! ; )
Guadalupe Vadillo
Hi Guadalupe! Many thanks for sharing this detailed data from your course – I will add it to the chart now 🙂 Thanks again!
Thank you!!! ; )
Hi Katy
Open2Study (www.open2study.com), the leading Australian platform offering free online courses, has recently published results for its first three intakes.
Completion rates for the first three cohorts have been greater than 25% which are more than three times the industry average.
Reports can be accessed at: https://www.open2study.com/research
Cheers
Paresh
Hi Paresh, Many thanks for the links to your detailed reports, they look to be a very valuable resource 🙂 I’ve added the completion data to the chart. Cheers! Katy
Pingback: Enseñanza Universitaria en línea, MOOCs y aprendizaje divergente | RED
Here are the end-of-course statistics from the recent run of Learn to Program: The Fundamentals (started 19th August 2013 at Coursera, from an email from the course instructors):
# users registered at close of course: 66,510
# users who watched the first video: 48,520
# users who watched the last video: 10,935
# users who submitted the final exam: 8,600
# Statements of Accomplishment: 7,839
Course work statistics
Here are the number of people who submitted each exercise and assignment:
E1: 24,559
E2: 17,672
A1: 14,273
E3: 13,278
E4: 12,029
A2: 11,054
E5: 10,482
E6: 9,399
A3: 8,405
E7: 8,366
Pingback: Synthesising MOOC completion rates | MOOC | Sco...
Hi,
Here is the Fall session of Stanford’s “Introduction to Mathematical Thinking” (Coursera), as released by Prof. Devlin at the end of the course:
Total enrollment: 58,300
Total active at some time: 44,141
Total active in final week: 4,961
Total deemed to have completed the course: 3,900 (i.e., more than minimal activity)
Total submitting Final Exam: 978
Number of students receiving a SoA: 3,167 (grade at least 14%)
Number of students awarded a SoA with Distinction: 676 (grade at least 57%)
Cheers
Hi J! Many thanks for sharing this information – I’ve added it to the chart 🙂
Hi Katy
More MOOCS results:
Average completion rates for cohort 4 on the Australian Open2Study platform were greater than 27%.
Details are now available online at: https://www.open2study.com/research
Cheers
Paresh
Pingback: MOOCs, Udacity y proyecto ReuseTIC | Compartia.net
AbiertaUGR (http://abierta.ugr.es) is a Spanish MOOC initiative of the University of Granada. In a pilot of this year with had:
3051 enrolled
1986 active users
843 got certified
-> completion rate of 42.83%
Hi Rosana! Many thanks for sharing this information. I’ve added it to the chart (but used completion rate as a percentage of enrolled for consistency with the other data). There are a couple of further pieces of information I’d like to add if possible please: When did the course start? How long did it run for? And how was it assessed? Many thanks! 🙂 Katy
MOOC GdP #2 (project management, France, stat for GdP#1 above ) just finished the two first certificates (team certificate is still ongoing, but it’s much smaller)
enrolled 10848
basic certificate active students 5711 47% dropout rate
basic certificate success 3486 61% basic certificate success rate
advanced certificate active students 1011
advanced certificate success 790 78% advanced certificate success rate
detailled & updated figures : http://goo.gl/Ia7Syw
Hi Katy
Latest Australian Open2Study MOOCS results:
The average completion rate for first six cohorts on the Australian Open2Study platform were greater than 25%.
The latest performance report for cohorts 1 to 6 is now available online at: https://www.open2study.com/research
Cheers
Paresh
Hi Katy
Understanding Dementia, the University of Tasmania’s first MOOC, and one of the first on the Desire2Learn platform, was an 11-week course offered by the Wicking Dementia Research and Education Centre that attracted 9267 registrants and achieved a 39.1% completion rate (as a percentage of total registrants).
Date: July-October 2013
Number of completers: 3624
Number of registrants: 9267 (39.1% were completers)
Number of participants (i.e. those who logged in): 7731 (46.9% were completers)
For more information, please refer to http://www.utas.edu.au/wicking/wca/mooc/data/
Hi Netty, many thanks for sharing this data! I’ve added it to the chart 🙂 Best wishes, Katy
Pingback: Enseñanza Universitaria en línea: MOOC, aprendizaje divergente y creatividad (I) | RED
Pingback: Enseñanza Universitaria en línea: MOOC, aprendizaje divergente y creatividad (y II) | RED
Pingback: Enseñanza Universitaria en línea: MOOC, aprendizaje divergente y creatividad (III) | RED
Pingback: Enseñanza Universitaria en línea: MOOC, aprendizaje divergente y creatividad (y IV) | RED
Hi Katy!
Here are some statistics for the Coursera class “Principle of Microeconomics” taught by Dr Stein and me last spring:
Enrolled: 35,814
Accessed ever: 18,043
Watched at least one video: 15,458
Took at least one quiz: 4,905
Submitted at least one peer assessment: 1,625
Earned certificate: 739 (472 with distinction)
The course included both auto-graded and peer-graded assignments.
Hi Gloria! Many thanks for sharing the information about your course 🙂 I’ve added it to the chart. Best wishes, Katy
Pingback: Presentación del libro “Los MOOC en la crisis de la Educación Universitaria. Docencia, diseño y aprendizaje” | RED
I see you didn’t enter stats for MOOC GdP #2 above, but I now have stats for GdP 3 and 4 as well. Get in touch if you need
Hi Rémi – apologies for not adding the information about MOOC Gdp #2, I think I must have missed your comment when I was preparing for my maternity leave. I’ve been having a bit of a break from the MOOC data recently while I have been focusing on my PhD project, but am preparing an update for the chart. The MOOC Gdp #2 data will definitely be included; if you could share the data from #3 and #4, I will add them too. Many thanks!
Thank you Katy!
I’m currently at eMOOCs2015 and there is a large amount of data available. As for MOOC GdP, we now hae data for 5 session see slide 22 & 23 here http://fr.slideshare.net/bachelet/mooc-gd-p-69-barcamp-emoocs2015
the question is how MOOC completion rates are calculated in your data. For me I use two ratios
* enrollement / inactive : entry rate
* active in a given track / success : success rate
so tell me what you need!
At present, I’m just using completion rate calculated as the number students who achieved a certificate, as a percentage of the total enrolment.
I’m hoping to find time to start a new version of the chart which shows completion rate as a percentage of active users (since more of this type of data is available now than when I started out), so this would be useful too.
Enjoy the conference – I wish I was there, it looks like a great event. I’ll definitely be reading the proceedings. Thanks again 🙂
Hi Katy!
so here is a recap of the stats (details available on URL above)
For GdP1, 2, 3, 4 and 5:
enrolled
3493 + 10848 + 11827 + 19171 + 17579= 62.918
Entry rate = active students / enrolled
66% // 53% // 50% // 42% // 28%
Classic track success rate = success for the 25h track / taking part in 1+ quiz
57% // 61% // 38% // 41% // 47%
advanced track success = success / 1+ assignement submitted
80-70% stable
classic track laureates
1328 + 3486 + 2222 + 3231 + 2282 = 12.549
adv track laureates
453 + 790 + 705 + 861 + 503 = 3.312
Hi, we just released some statistics about seven courses from 2014 on openHPI on our Blog – see: https://blog.openhpi.de/2015/03/a-look-ahead-and-back/
If you need more info, just contact us!
Moritz, openHPI Team
Hi Moritz, many thanks for getting in touch! The blog link isn’t working for me though, is the site down? (I tried to email too but it bounced). Thanks!
Pingback: MOOCs, Udacity y proyecto ReuseTIC - Compartia Research
Hi, Kathy!
Thank you for your work!!!
I also wanted to share my stats:
a. On the 2nd session of Ser más creativos (Universidad Nacional Autónoma de México, UNAM, at Coursera) in 2014 we had:
6 weeks 32,850 enrolled with 3,821 course completers (11.63%).
b. In 2015 we have been offering the same course in the On demand platform (always open and self-paced): we have had 83,901 enrolled participants and 2,769 have completed the course (3.3%).
c. In October 2015 we launched another on demand MOOC. It’s called Aprender (Learning) it is always open and self-paced and in its first 5 weeks it has had an enrollment of 8,588 participants and has 182 course completers (2.12%). Also a UNAM course at Coursera.
As you can see, self-pacing means a lot less completers. I will explore a new “in-between” possibility: auto – cohort where every three weeks a new cohort begins the course and, according to Coursera, that dynamic tends to foster better results. I’ll get back to you when we have data.
Thanks again, best,
Guadalupe Vadillo
I forgot to say that both courses have auto and peer grading.
Thanks again!!